Exploratory data analysis (EDA) is an essential first step in any data science project. Consider it the equivalent of an annual doctor’s check-up but for data science projects. I have long believed that EDA can be automated as the tasks are very general. While there are existing R packages for EDA such as DataExplorer, summarytools, tableone, and GGally, I have not found what I was looking for. Leveraging GPT-4, I was able to create an EDA script in just a few hours.
The result is an RMarkdown template for EDA, designed to work with any dataset. The concept is straightforward: you input a dataset containing both numerical and categorical data, and the template automatically crafts a detailed EDA report like this.
Here’s how the template operates:
- Starts with a data summary.
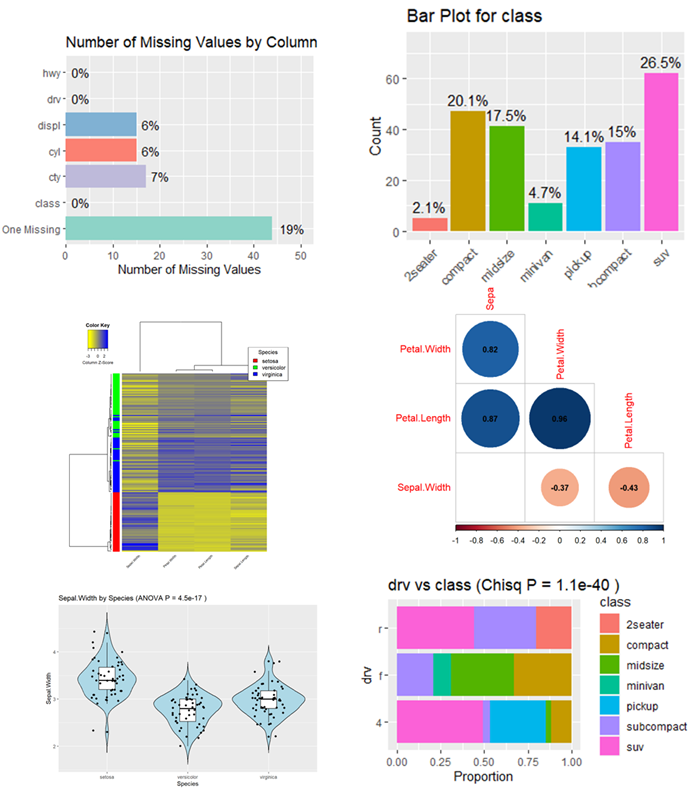
- Any missing values and outliers?
- Plots distribution of numerical variables using histograms and QQ plots. When excessive skewness is present, a log transformation is recommended.
- Distribution of categorical variables.
- It provides a general data overview with a heatmap and a correlation plot.
- Correlation matrix (corrplot)
- Scatter plots to examine correlations between numerical variables.
- It uses violin plots and performs ANOVA to study the differences between groups delineated by categorical variables.
- Are categorical variables independent of each other? Uses Chi-squared test and bar plots.
To use this RMarkdown file, you just need to obtain a copy from my GitHub repository. Replace the demo data file with your own, specify a target variable, and you’re ready to go render the report.
If that sounds like too much work, simply upload your data file to RTutor.ai, and click on the EDA tab. A comprehensive report will be generated in 2 minutes. The template was originally written for RTutor.
0 Comments